The perfect recipe: 7 essential data quality checks
Picture this. You’re throwing a dinner party and inviting the people you most want to impress. Would you make a meal with out-of-date ingredients? It could make your guests very sick. Likewise, with data being the lifeblood of good decision-making, you don’t want to be feeding bad data into your business and tarnishing your reputation in the eyes of your customers.
The cost of poor quality data
Bad data is costly. According to Gartner, it costs businesses an average of USD$12.9 million a year (AUD$20 million). Poor quality data could lead to an array of problems, such as underestimating demand for a product, sending marketing campaigns that target the wrong demographic or misclassifying financial statements. Think about the lost opportunities if your data teams are constantly cleaning up data quality issues, instead of focusing on improvements and innovations to your pipelines.
And with the advent of GenAI on everyone’s minds – the truism of “rubbish in, rubbish out” has never been stronger. The ability to leverage AI relies on building a foundation of high quality data to generate accurate and reliable insights.
The answer to stamping out bad data is simple – data quality checks. In this article, I’ll cover the essential data quality checks data teams should think about. Soon enough, we’ll be pumping Michelin quality data through your business and building up a long line of satisfied customers!
What are data quality checks?
Data Quality checks (or DQ for short) is a way to ensure that the data used by a business meets the following criteria:
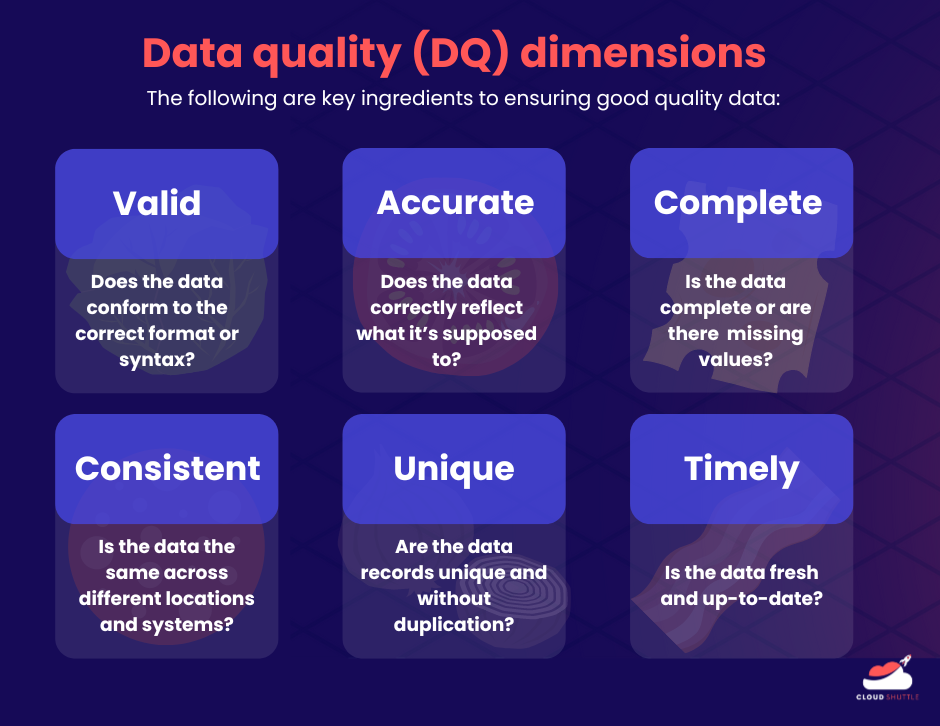
- Valid: Does the data conform to a particular format or syntax? Is it of the correct information type and does it fall in the correct range?
- Accurate: Does the data correctly reflect what it’s supposed to?
- Complete: Are there any missing or null values in important fields?
- Consistent: Is the data the same across different locations and systems? Do the values reconcile or are they conflicting?
- Unique: Are the data records unique or are there unnecessary duplications?
- Timely: Is the data fresh and up-to-date for its intended use?
Data engineering teams should ensure data conforms to the above dimensions before it’s consumed downstream by other users.
What data quality checks are essential?
Now that we have a good idea of what dimensions contribute to quality data, let’s talk about the DQ checks we can put into place. Data quality checks are like health and safety inspectors that make sure every ingredient in your kitchen (dataset) is up to standard before it goes into your business’s main course (operations).
Here’s my top list of data quality checks:
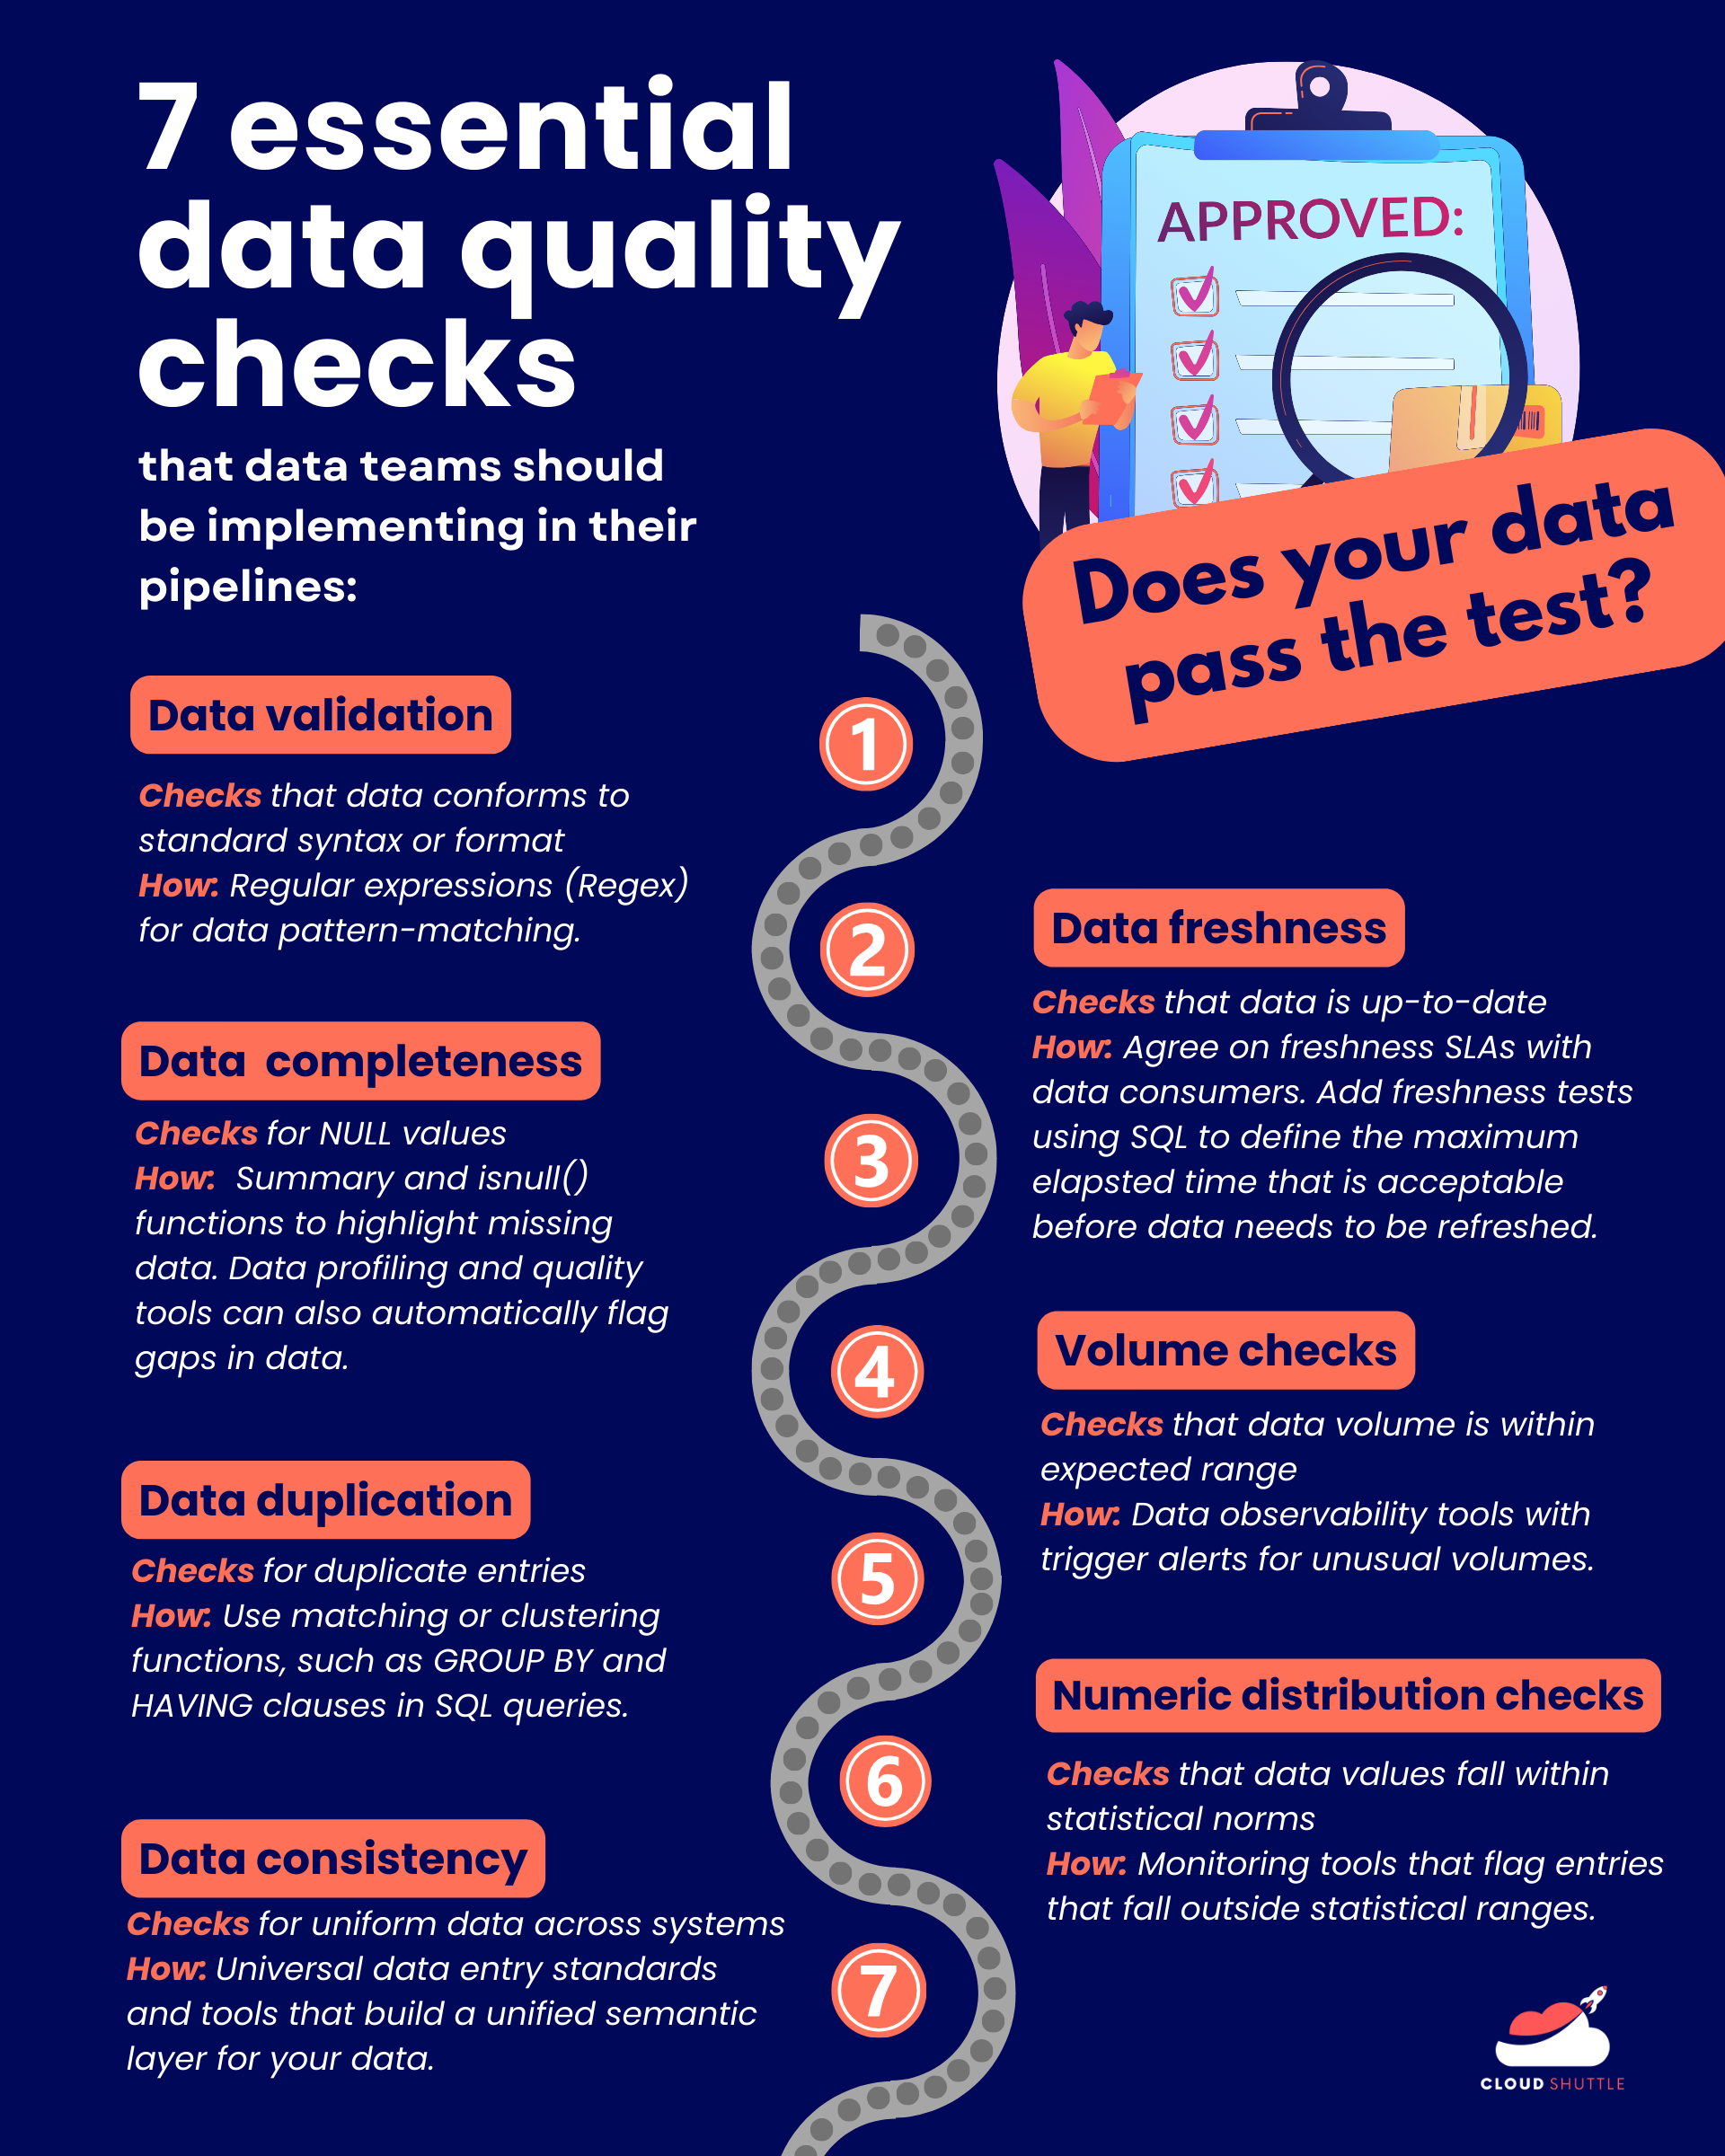
1.Data validation
What it is:
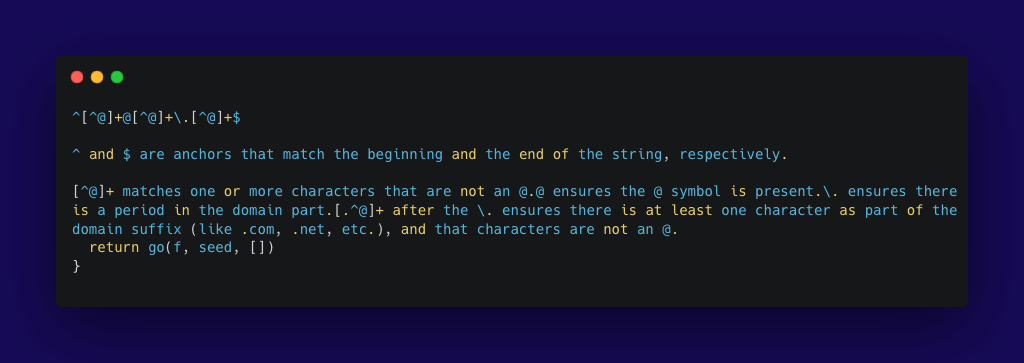
Think of this as checking that each ingredient comes with a quality seal before use. (If not, the ingredient shouldn't be allowed to leave the factory.) Data validation uses a set of rules to check if the data conforms to a specific format or standard as required by the business rules, such as making sure email addresses contain the “@” symbol and a domain.
How to implement:
Data validation checks are best implemented at the source before it’s imported or processed. Regex are a common tool to check for data pattern matching and validity at the point of entry, for example in a website signup form.
2. Data completeness
What it is:
Akin to making sure you’re not missing ingredients before you start cooking, data completeness checks ensure that there are no null values where data should exist, particularly in key fields without which the data set would be considered unusable. Incomplete data can skew results and introduce biases.
How to implement:
How do you handle NULL values, empty strings and ‘0’? (and as a quick aside, they are not the same thing!).
Use summary functions and isnull() function to highlight missing data. Data profiling tools can generate reports on data completeness, validity and other measures of data health. Handling incomplete data involves identifying the root cause, such as whether the data is truly missing, got corrupted along the way, or is not applicable. Then, decide on an appropriate method to deal with it, such as accepting the missing data, removing it or imputation (inferring the missing data).
3. Data duplication checks
What it is:
Just as you don’t want to double up on the amount of salt and skew the balance of your dish, make sure you have data duplication checks so you don’t end up with redundant data entries. Duplicate data can occur due to multiple data entry points, errors in data migration or simple human error. For example, the same customer might forget they have an existing account and create another one with a different email address.
Things like sales transactions and financial transactions have to be unique records. Otherwise, it can cause confusion, inaccurate reporting and forecasting problems and even increase the risk of fraud.
How to implement:
Begin by first defining what is considered a duplicate in your business context. Are records considered duplicates if they match in key fields, or only if they fully match across all fields.
SQL queries with GROUP BY and HAVING clauses can identify duplicates. (see a quick guide here). Handling duplicates involves making decisions on which record to keep (for example, the most recent one) and whether to merge information from duplicate records. Whatever decision is made to resolve duplicates, make sure valuable data isn’t lost in the process.
4. Consistency checks
What it is:
Consistency checks are like making sure every dish you serve at your party has the
same high quality and taste. (A little like how global restaurant chains like McDonalds’ engineer their recipes and ingredient sourcing to provide a consistent taste and experience, no matter where their customers go in the world)
You’d want to make sure that your data remains uniform across different systems and databases. Differences can come up when various entities handle data differently. For example, a US-based company that acquires an Australian company might see a mixture of MM-DD-YYYY and DD-MM-YYYY formats.
How to implement:
Start by setting universal data entry standards and formats across your entire organisation, and documenting them. This will break down the data silos. Software exists that can normalise your data pipelines and unify variations of how data is represented to enable interoperability and system compatibility.
Once key metrics have been defined, tools like dbt can be used to build a semantic layer to create a unified view that maps different data definitions from different sources into a consolidated view.
5. Freshness checks
What it is:
Data freshness checks - well this one is self-explanatory! No dinner host wants to serve stale food to their guests, so make sure your data is current so it’s useful for the data consumers in your business. This is true for all companies, but particularly in industries like Fast-Moving Consumer Goods where outdated information can lead to pricing errors, mismanaged inventory and products that don’t meet customer demands.
How to implement:
Generally speaking, the value of data decreases over time. Start by understanding and setting an agreement with your data consumers about how frequently they access the data and how often it needs to be refreshed. For example, the accounting team may only need a monthly update for their report as opposed to the inventory team, who need to see transactions in real-time to make sure they are able to manage their stock levels effectively.
Many data warehousing solutions have in-built features that automate the data refresh process and data observability tools use anomaly detection to identify any outliers that are way past their ‘use-by date’.
6. Volume checks
What it is:
Volume checks are all about ensuring that the amount of data you have coming in at any given time is within the expected range. If you’re having 10 guests over for dinner, you want to make sure you have enough ingredients to feed them all without having too much wasted leftovers.
Let’s say your company typically records 500 new subscriptions a day. If the data shows a jump to 5000 subscriptions in one day, this would be an anomaly. It could be a genuine case of increased demand due to a viral marketing moment or celebrity endorsement, or it could be something sinister, like a bot attack creating fake accounts. Conversely, if you see a sudden drop to 50 sign ups in a day, this could indicate a problem in the signup process or payment system.
How to implement:
Data observability tools can automate volume monitoring, using thresholds to trigger alerts when data volumes are unusually high or low, which could indicate data pipeline issues or anomalies in data generation.
7. Numeric distribution checks
What it is:
Numeric distribution checks are there to make sure that your data values fall within expected patterns or statistical norms. Just as you wouldn't serve five desserts and one appetiser for a balanced meal, your data should reflect realistic distributions that align with historical patterns or predicted behaviours.
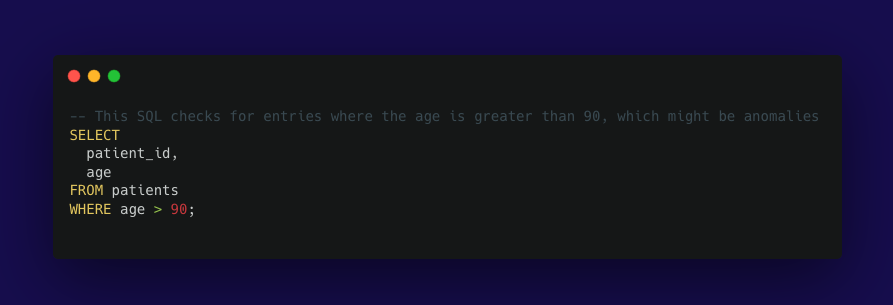
For example, if a healthcare provider analyses patient data, the ages are expected to range broadly but realistically. If the typical data set rarely shows ages above 90 but analysis reveals a sudden and significant increase in patients listed as over 90 years old, this could flag potential errors that need to be investigated. It could be that a data entry error caused unrealistic age data to be recorded, such as entering '190' or '902' instead of '90'.
How to implement:
Using statistical tools to monitor these distributions, such as setting maximum expected age limits or flagging entries that fall outside typical statistical ranges, helps maintain data accuracy.
We can create ad hoc SQL queries to detect age anomalies, then translate these checks into dbt YAML configuration.
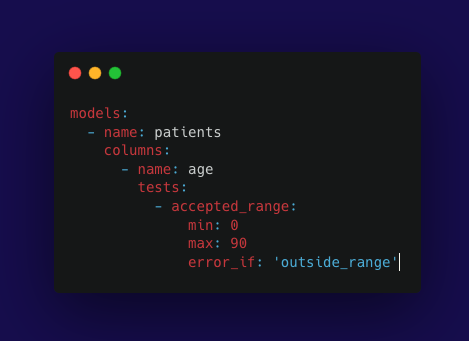
In this dbt configuration:
- The accepted_range test is set for the age column, specifying that acceptable ages are between 0 and 90.
- The error_if: 'outside_range' part tells dbt to raise an error if the age values fall outside these ranges.
Data Quality best practices
So we know what maintaining data quality is important, and we know the essential checks we have to do to ensure we keep those standards high. What are some best practices to keep in mind?
- Establish a data quality culture: Data and analytics leaders should make data quality a high priority. Initiate conversations with business stakeholders and data consumers and ask:
- Which data assets are the most important?
- What are the use cases that the stakeholders will be using their data for?
- Where have there been data quality issues in the past?
- Profile your data early and often: Data profiling involves examining the data and understanding its structure, content and overall quality. By profiling your data early on, you can quickly pick up anomalies and target specific strategies to address them to avoid further problems downstream.
- Implement automation and alerts: DQ tools like Great Expectations, Soda and Deequ provide continuous monitoring and validation of your data against pre-defined rules and standards and send automated alerts. This makes it easy to pick up data issues as they occur so that quick intervention can take place.
- Documentation: Document clear guidelines and standards for data handling processes. Clear documentation that details data validation rules and error handling makes it a lot quicker to troubleshoot and resolve issues. Read my blog post on how documentation is key to reducing firefighting for data teams.

- Upskill your team: Training team members on the latest data management practices, tools and technologies can help them be more effective at handling data issues and better leverage DQ tools to ensure data is accurate, consistent and reliable.
Conclusion
Maintaining data quality isn't down to a single ingredient. It’s a recipe that brings together multiple steps to perfect your data dish. And just like chefs need to fine tune their dishes, remember to test your data often. By blending the right tools, techniques and team training, your data can always serve up high-quality data, ready to delight business users and customers alike.
At Cloud Shuttle, we can help you implement rigorous data quality checks that keep your data pipelines clean and efficient and support your team to upskill on DQ best practices. Connect with us today!
RELATED_NODES
NODE_CHAIN // SIG_FAST
NODE_01
Static egress IPs for Postgres on Fly.io: an Envoy egress proxy
Jun 8, 2026 · 06m read
NODE_02
AI Observability in Action: Cost Measurement & Evals with Bifrost, Langfuse, and Drover
Jun 5, 2026 · 06m read
NODE_03
Self-Governing Codebases: Bridging the Code-Architecture Gap with Governed RLMs
Jun 4, 2026 · 06m read
Cloud Shuttle Insights